Indian IPO Analytics
NSE/BSE market data analysis and risk clustering
The problem this had to solve.
Turn a small curated Indian IPO dataset into an inspectable analysis of listing performance, demand, issue size, sector, and post-listing returns without presenting the results as a trading model.
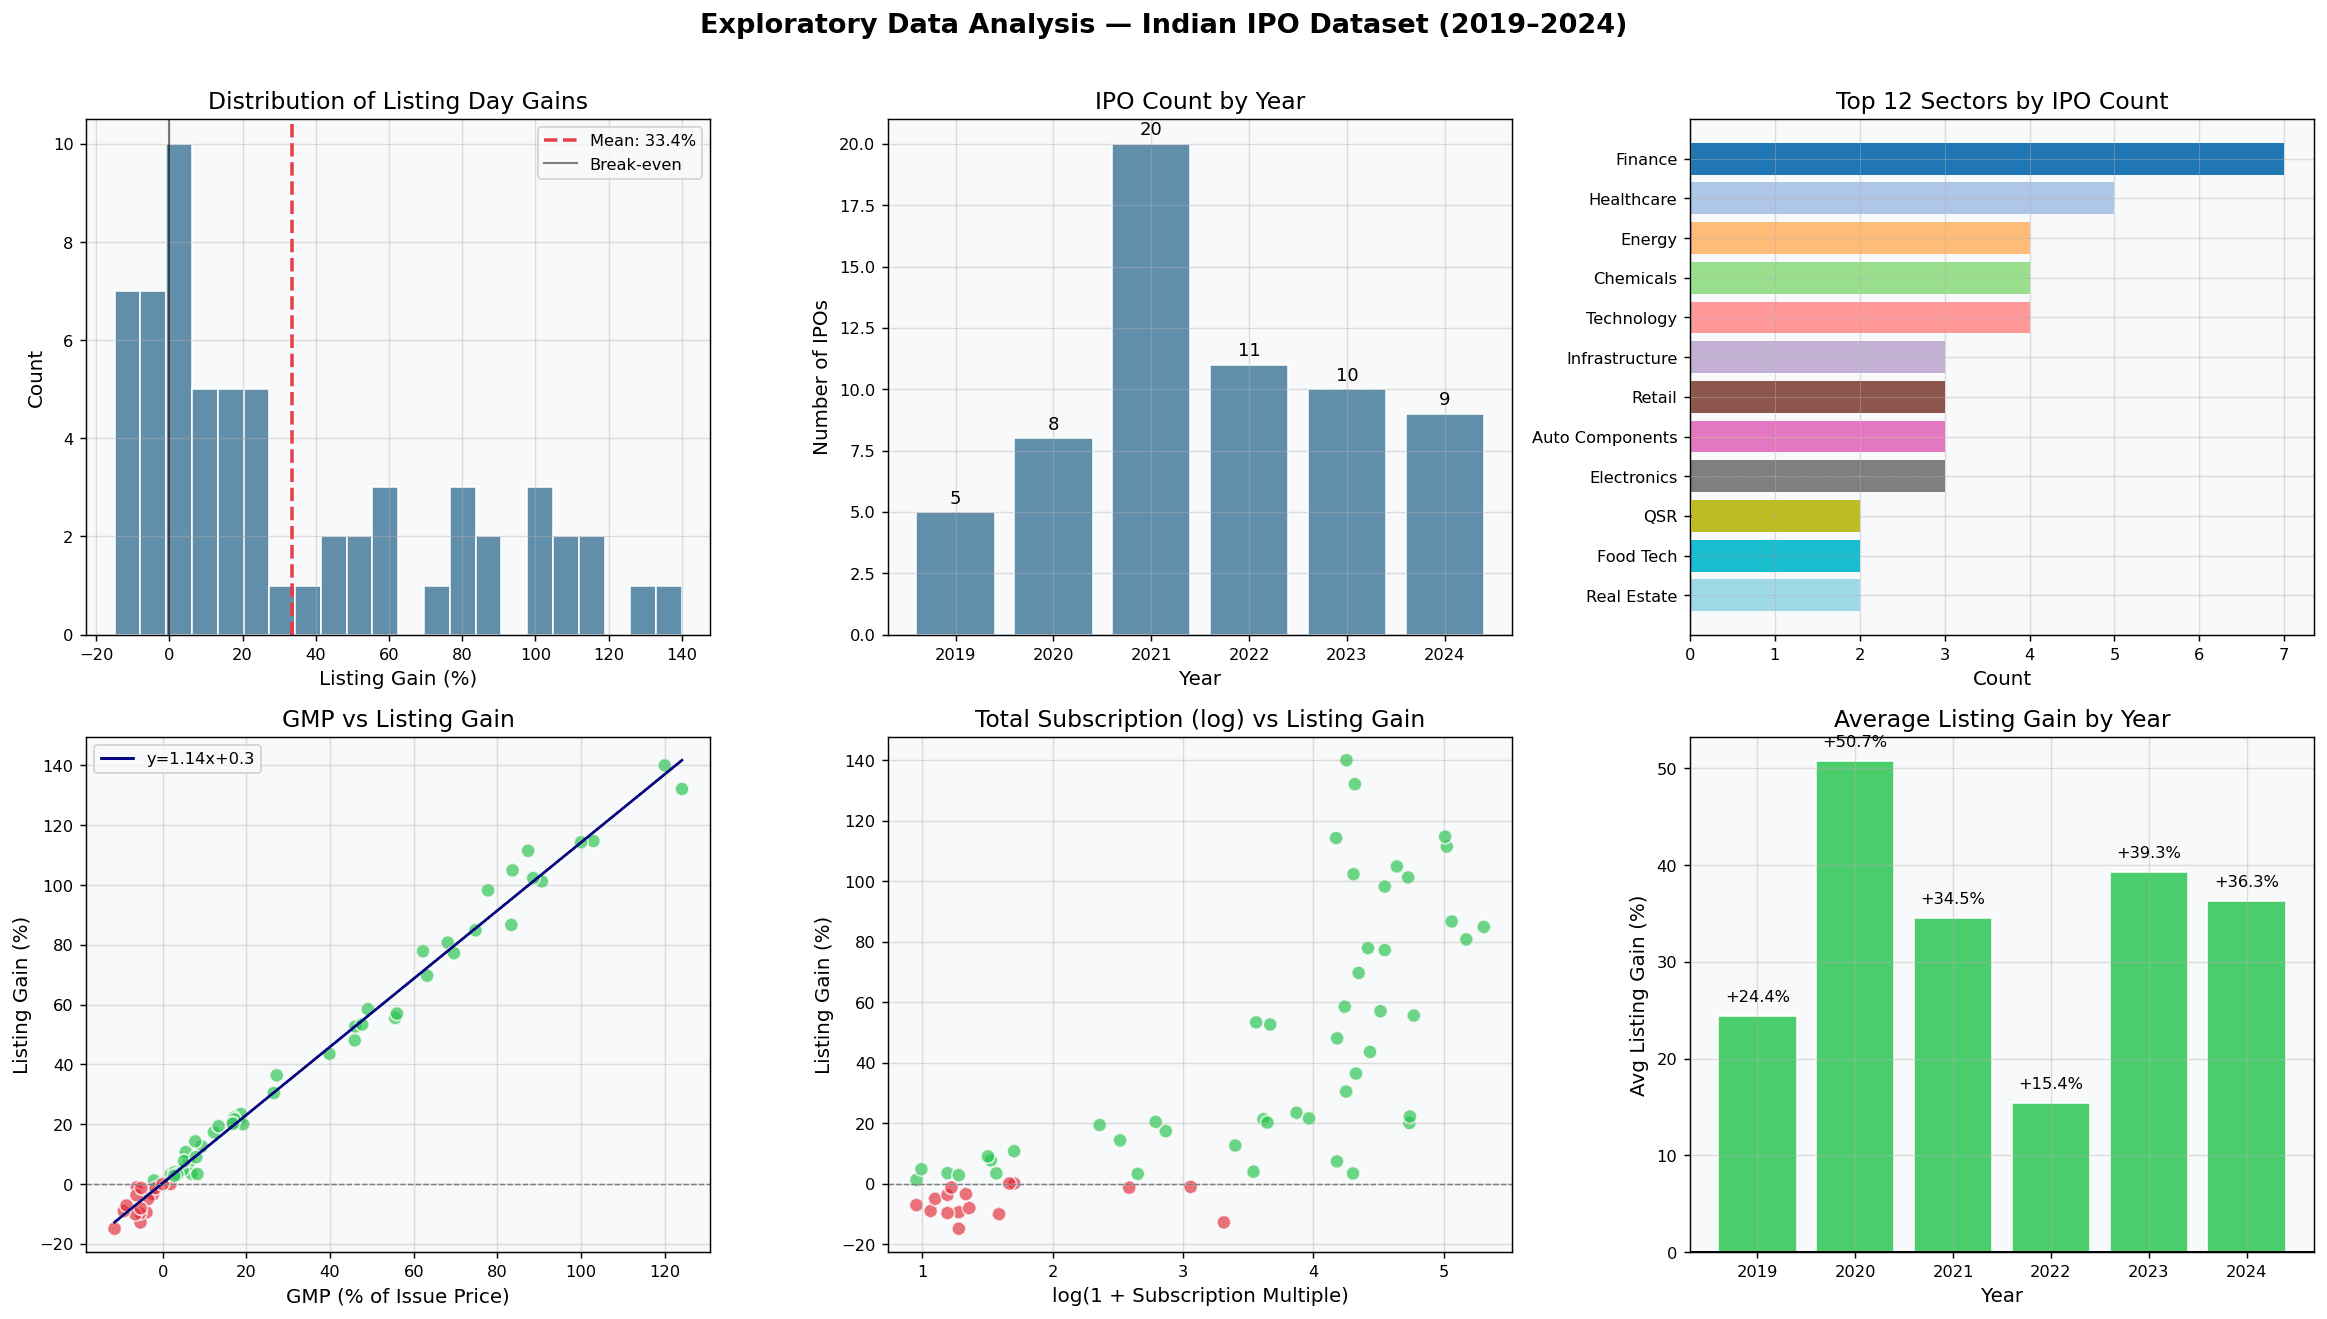
Indian IPO Analytics studies 63 NSE/BSE IPO records across 27 sectors from 2019 through 2024. The project builds a 34-column table with complete enriched return coverage for its dataset.
Regression, clustering, and distribution analysis feed an interactive Plotly Dash dashboard. Results include approximately 0.9808 five-fold cross-validation R², approximately 4.15% MAE, and two K-Means risk clusters; these remain project-dataset findings rather than general financial predictions.
Constraints
- The dataset contains 63 IPOs across 27 sectors from April 2019 through November 2024.
- Grey Market Premium is both an input and a close market expectation of listing performance, so very high listing-gain regression scores require cautious interpretation.
- Post-listing return enrichment uses cached/fallback values as well as yfinance; complete coverage does not mean every value was fetched live from one source.
- The Dash application is documented for local use at localhost and no maintained public deployment is listed.
How the system is put together.
NSE/BSE IPO records
63 records across 27 sectors from 2019–2024
sourceData enrichment
34-column table with complete project-dataset return coverage
processStatistical analysis
Regression, clustering, and distributions
processRisk clusters
Two K-Means groups in the project analysis
decisionDash dashboard
Interactive Plotly exploration
outputWhat was chosen, and what it cost.
Keep the workflow inspectable
- Choice
- Ship the notebook, generated figures, cached return data, and an interactive Dash application in the same repository.
- Rationale
- Readers can review both the analysis steps and the presentation layer rather than seeing only headline results.
Use several analytical lenses
- Choice
- Combine exploratory plots, regression, sampling, K-Means clustering, distribution fitting, and time summaries.
- Rationale
- The dataset supports descriptive questions beyond a single prediction score.
- Cost
- Many reported findings come from the same small curated sample and are not independent validation studies.
Qualify model results as dataset findings
- Choice
- Report held-out and five-fold regression results while keeping the portfolio language scoped to the 2019–2024 dataset.
- Rationale
- The model has not been evaluated prospectively or against a later market period.
How it was checked.
- The repository includes the executed notebook, eight generated figure files, and a local Plotly Dash application.
- The documented regression run reports train R² 0.9922, test R² 0.9834, test MAE 4.15%, and five-fold CV R² 0.9808 ± 0.0117.
- The clustering study selects k=2 with silhouette score 0.4740, while distribution checks reject a Normal fit at the 5% level for this sample.
What was measured.
Each figure states the conditions it was measured under. None of them describe production traffic.
63
IPO records
NSE/BSE IPOs in the 2019–2024 project dataset.
27
sectors
Sector coverage in the enriched analytics table.
0.9808
5-fold CV R²
A result of this project dataset, not a universal prediction claim.
~4.15%
MAE
A project-dataset regression result.
Where this stops being true.
- The sample is small, curated, and limited to one country and market period; the findings are not a prospective return forecast.
- The repository does not document a leakage audit, temporal validation split, uncertainty intervals for predictions, or transaction-cost analysis.
- GMP alone explains 99.0% of listing-gain variance in the documented run, which limits what the regression demonstrates about less direct features.
- No automated test suite or hosted dashboard is present in the public repository.
What it is built with.
Runtime & interface
- Python
- Dash
Data & evaluation
- Pandas
- NumPy
- SciPy
- Scikit-learn
- Statsmodels
- yfinance
Infrastructure & providers
- Plotly